
Current State
The existing Forecasted Balance Report (aka Vacation Liability report) is designed to execute one absence at the time, specifically Vacation.
In addition, since the report includes monetary value, it is available only for administrators, i.e. it is not available for other users.
Improvement
Added a new report that will display multiple absences and can be launched from the Reports section.
The new “Forecasted Balance Report – Combined” is almost identical to the existing Forecasted Balance report.
The differences are:
- Combined display of multiple absences per employee.
- Color-coded using assigned colors in absence code definitions .
- Planned and Actual are in separate columns.
- The report can be executed from the standard Report tab.
Note
Absence codes can be managed either in days or hours.
The report currently does not provide any indication if the value is in hours or days.
Activation Settings
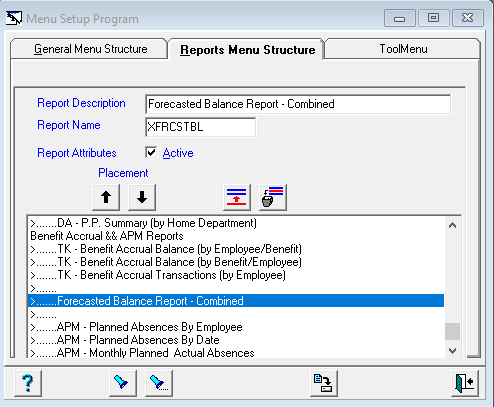
Reports Menu
Reports & Graphs > Benefit Accrual & APM Reports >
Report Description : Forecasted Balance Report – Combined
Report Name: XFRCSTBL
Report Parameters
Same as the existing Forecasted Balance report.
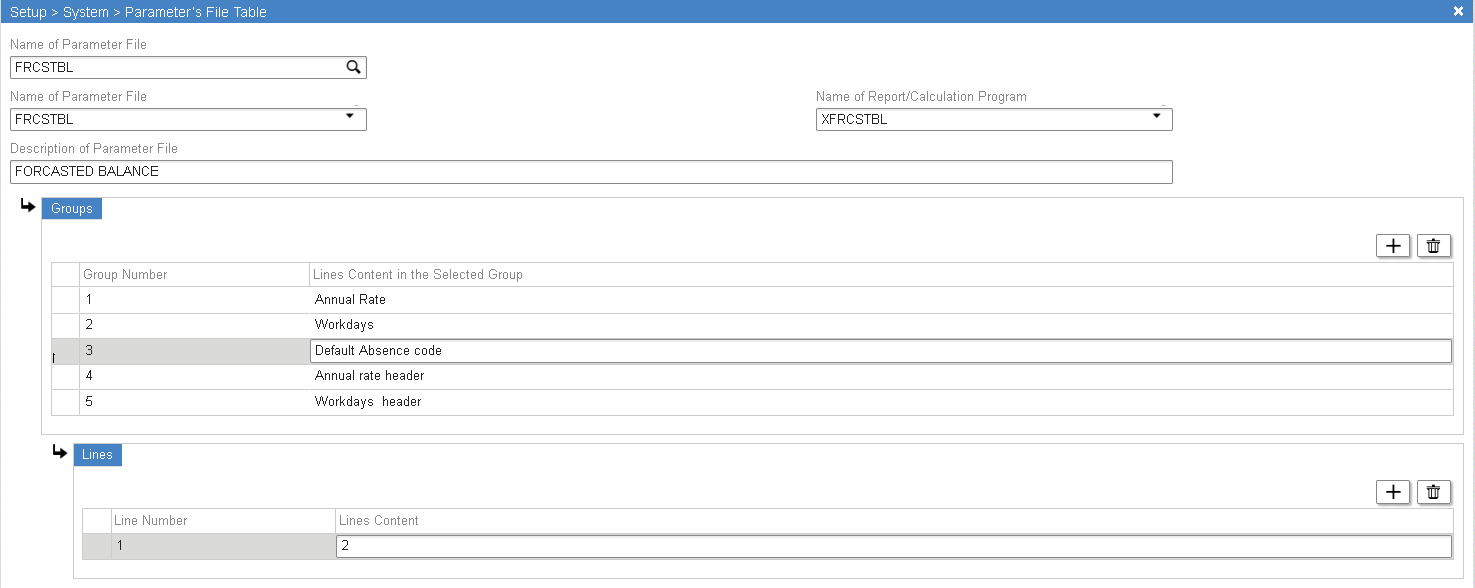
Setup > System > Parameter’s File Table
Parameter File Name: FRCSTBL
Report Name: XFRCSTBL
Group 1 – Table and Field numbers for Annual Rate value.
Group 2 – Table and Field numbers for Workdays value.
Group 3 – Default Absence code to display in the report filter.
Group 4 – Set the annual rate header description for two languages.
Group 5 – Set the workdays header description for two languages.
User Operation
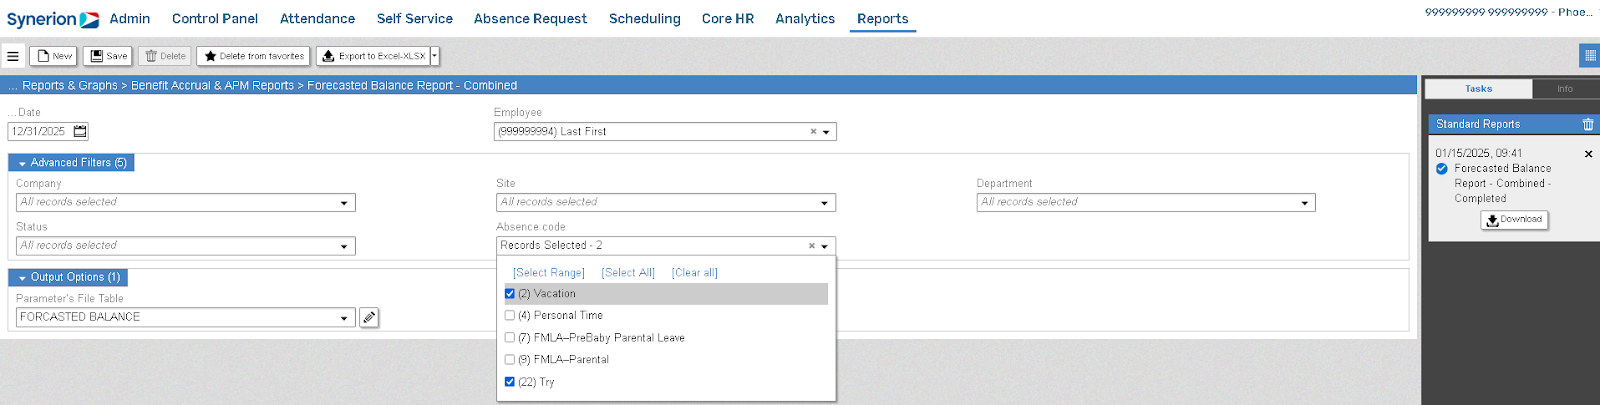
Reports & Graphs > Benefit Accrual & APM Reports >
Forecasted Balance Report – Combined
Specify forecast Date (end of the accrual year), Absence Codes and filters such as Employees, Plant, Site, Department and Status to see the forecasted balance.
Output
The report currently does not provide any indication if the value is in hours or days.
Code (2) “Vacation” in hours
Code (22) “Try” in days

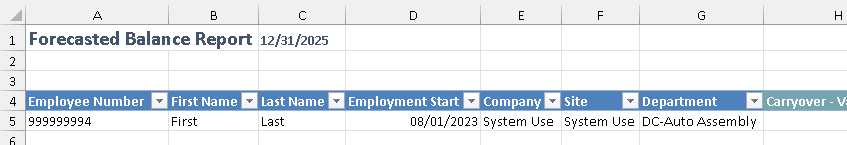
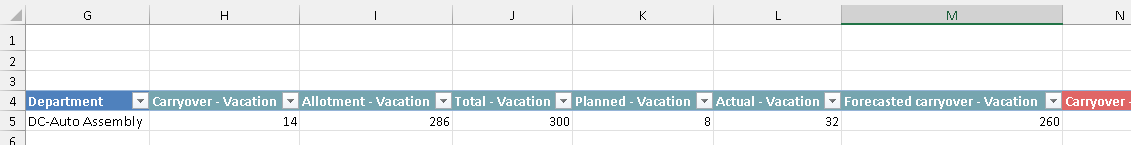
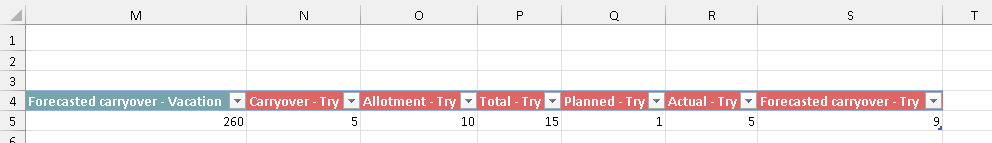
Columns
For each selected Absence Code, the following fields will be displayed:
Carryover = Absences carried over from the previous accrual year to the current one.
Allotment = The amount entitled calculated out to the end of the accrual year for the current year.
Total = Carryover + Allotment.
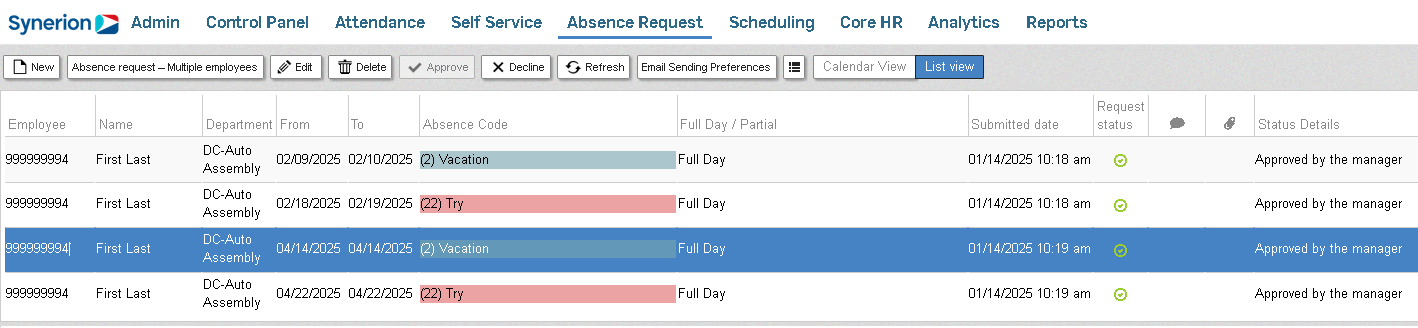
Planned = Future planned and approved absence requests.
Actual = Used absences in the current accrual year.
Forecasted carryover = Total – (Planned + Actual).
Example
Employee’s accrual period is from January 1 to December 31.
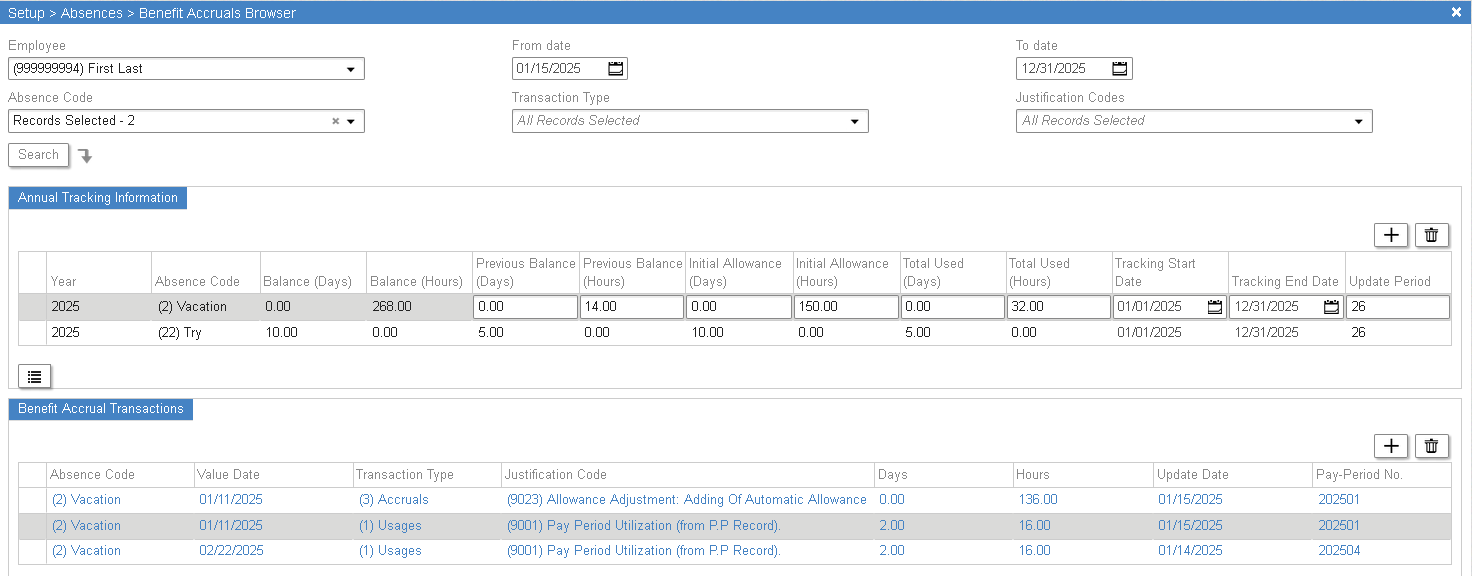
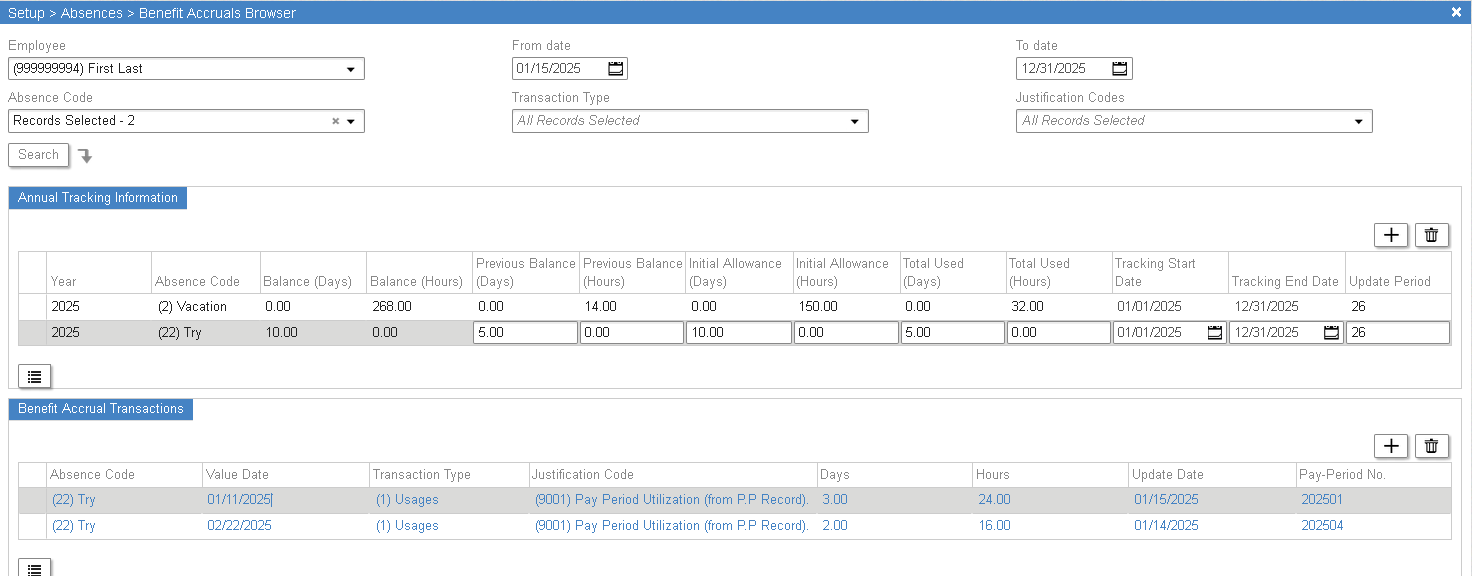
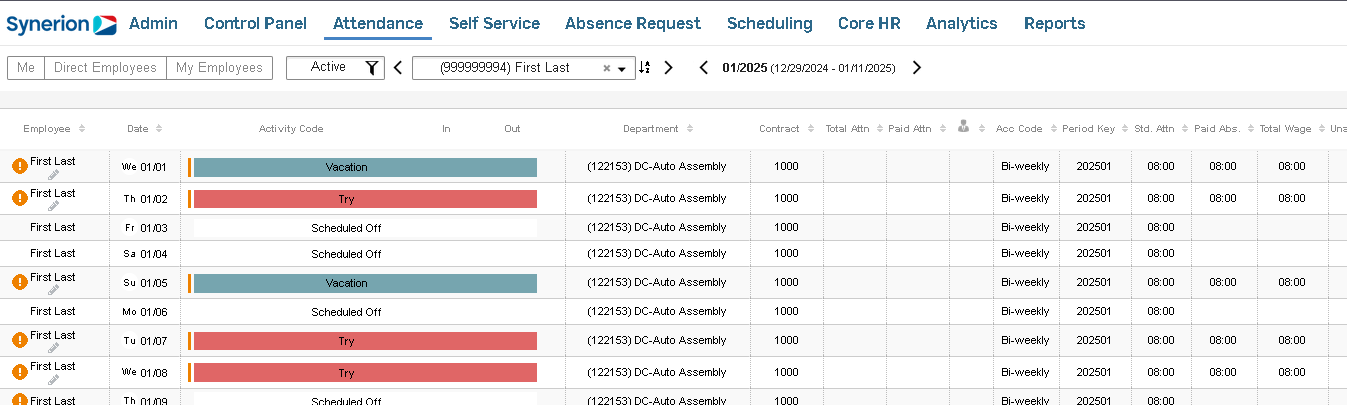
Used absences in January and February:
- 32 hours in code (2) “Vacation”
- 5 days in code (22) “Try”
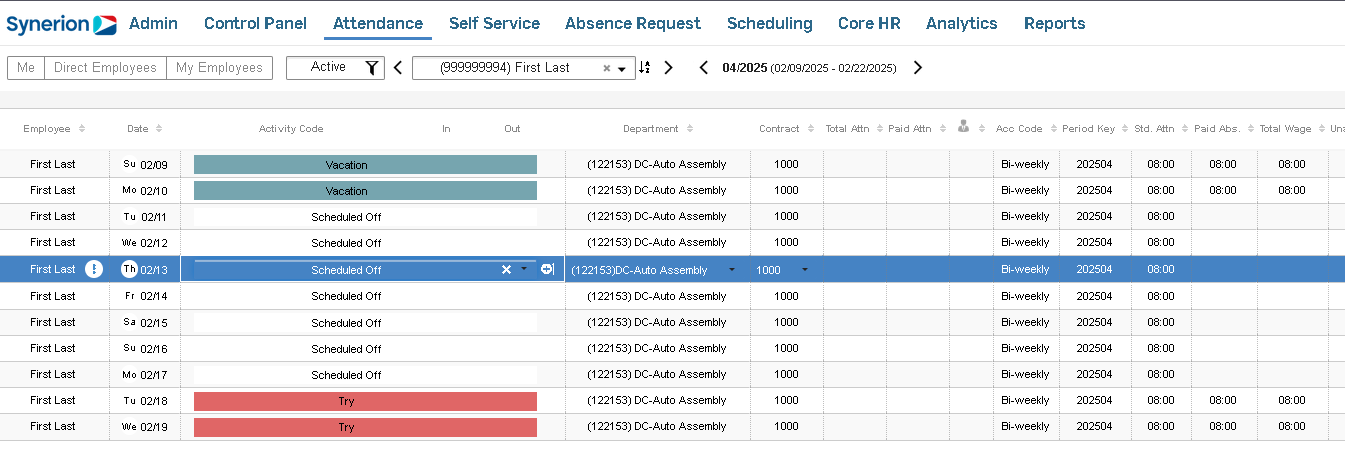
Approved future absences in April:
- 8 hours in code (2) “Vacation”
- 1 day in code (22) “Try”
Forecast balance for December 31, 2025:
Code | (2) “Vacation” | (22) “Try” |
Carryover | 14 hours | 5 days |
Allotment | 286 hours | 10 days |
Total | 300 hours | 15 days |
Planned | 8 hours | 1 day |
Actual | 32 hours | 5 days |
Forecasted carryover | 260 hours | 9 days |

