You have the capability to pull any report from the system as well as the ability to create custom reports with the Report Generator. These reports will export to Excel.
- Log into Synerion Enterprise.
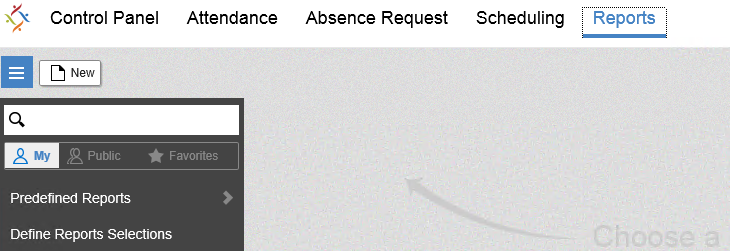
- Click on the Reports tab.
![]()
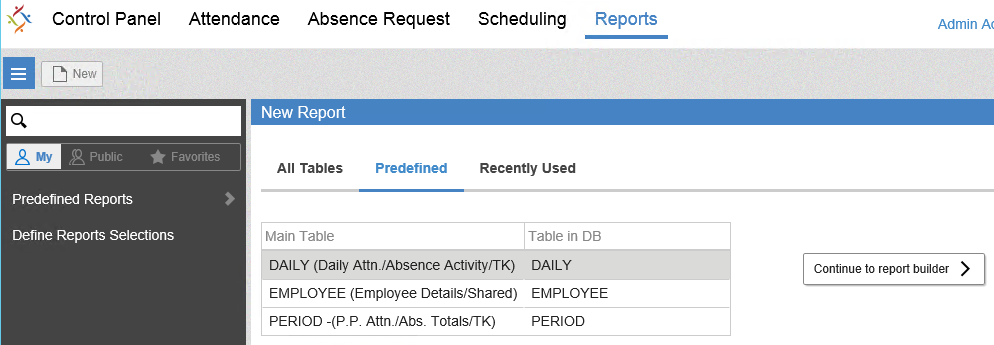
- The New icon on the top left of the Reports screen allows you to create your own/user defined reports as Microsoft Excel files.
- Select the table you wish to build the report from then click Continue to report builder.
- On the report builder screen there are three sections:
1
33
21222
2
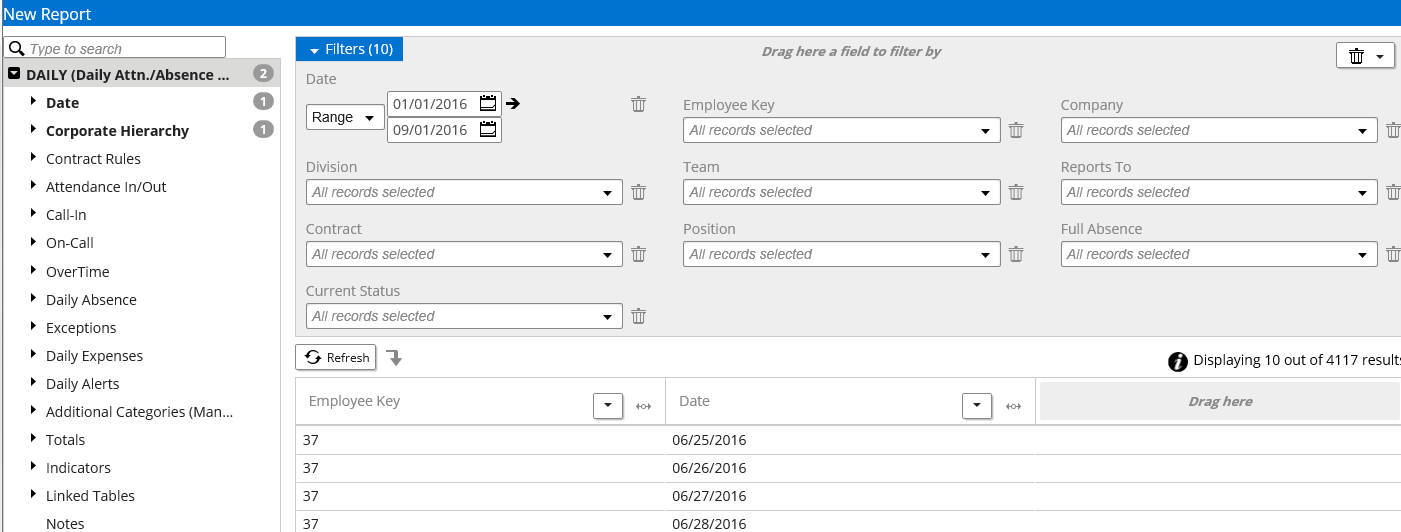
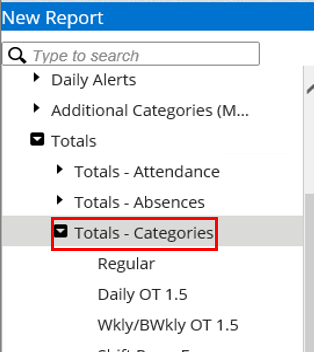
Section 1: Lists all the fields from the primary table and any related tables in the Synerion database. The fields are organized into data groups which can be expanded by clicking on the ![]() icon to the left of the group.
icon to the left of the group.
Section 2: Displays the filters that are available for the table you have chosen. These filters are applied when you execute a report which allows you to have only the data you require included in the report.
Section 3: Shows all of the fields that you have selected in Section 1. Here you can move the fields around so that you get them in the order you want.
- Click on the Expansion Icon
 on the first data group that you would like to choose. This will expand the data group and show you all of the available fields within that group.
As an example, we use the Total Categories data group. When expanded shows all daily attendance categories: Regular, Daily OT 1.5, Stat Holiday, etc.
Double click on a field or data group to add it on the report, it will be displayed on the Section 3. You can also drag a field or (whole) data element from Section 1 and place it on specific location in Section 3. If you add a data element to reports, all fields within that will be added. As an example, if you add Totals Categories then all 50 categories fields will be added to the report.
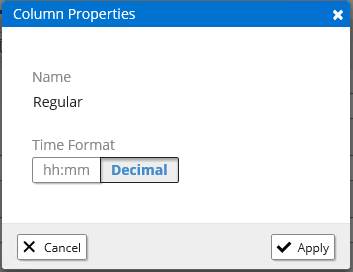
- In Section 3, you can move a field using the icon, Click and hold the icon on field you would like to move and drag and drop on the column where you like to place it. Use the dropdown icon on right of the field header to select Edit Properties for changing Time Format (if needed) or Delete Column to remove a field from report.
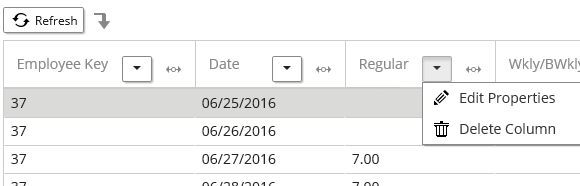
The Edit Properties option is only available for fields with time value.
You can also remove a field or data group from report (Section 3) by double click it on the Section 1.
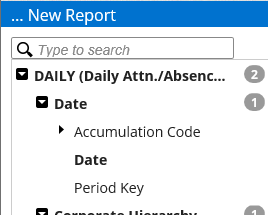
The number count to the right of a data group shows the number of fields selected from that group and when you expand the group, selected field is highlighted with bold font. The count on the first row with table name represents total count of selected field for the report.
- To setup/add filters you can drag a field from Section 1 and drop it to Section 2.
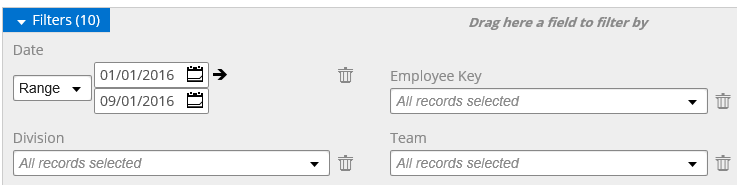
A dropdown is available for date or numeric fields to allow a Range of values, ‘=’ for a specific value or other numerical function as shown below:
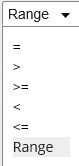
The ![]() icon beside a field appears when you select Range function. This represents From and To (range) between two values. To delete a field from Filters, use the
icon beside a field appears when you select Range function. This represents From and To (range) between two values. To delete a field from Filters, use the ![]() icon.
icon.
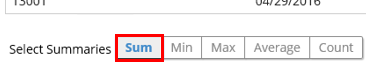
- There are few aggregate functions available as Summaries at the bottom of Section 3. These functions apply to fields with time and decimal values. To activate a Summaries function, click on the respective button. The selected Summaries will be added at the bottom of the output Excel file report.
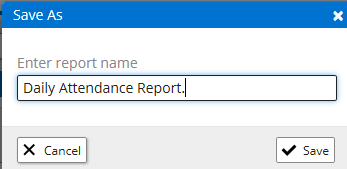
- The top section on the report builder shows options to apply on this report. To save this recently created report, click Save icon.

Because this is a new report the Save As screen will appear. Enter the name you would like for this report.
- To run the report, click Export button and you will see a progress bar on the right of screen. When completed click on the Download icon:
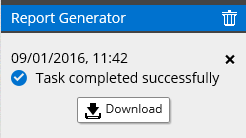
- Select Save As when prompted at the bottom of the screen, to save Excel file report on required folder on your computer. You can also select Save or Save and open option, in this case the file will be save on your Downloads folder. You may get a security warning screen based on your computer secutiry settings, click on ‘Continue with this website’.

Once the file is saved you get a prompt at the bottom of the screen to Open the file:

- If you like to share this report with others, click on Share button on the top icon tray. Select the required profile(s) and click Save.

The report can also be sent by email to selected employee(s) provided the feature is setup in the user profile.
The user defined reports appear in the Reports menu grouped by the respective table:
- The user defined reports appear in the Reports menu grouped by the respective table:
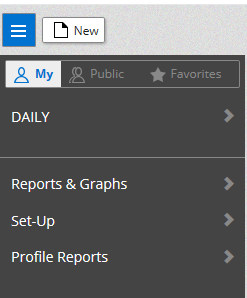
When you click on a report group the sub menu will list user defined report(s) under your select table group: